Fiscal targets explained...
The latest forecast from the Office for Budget Responsiblity show the Coalition government on track to meet its moving target to eliminate the structural deficit on current spending within five years. But what do the financial figures look like and what do they mean?
The government is aiming to remove the 'Cyclically adjusted deficit on current budget' within five years (on a rolling basis). This is the deficit on government spending (but not investment, or capital, spending) that does not get eroded with economic growth. When an economy goes into recession, tas revenues go down (people out of work, having pay cuts or pay freezes) and spending goes up too (benefits to those out of work or on low incomes). This usually results in the government having to borrow each year, the cyclical deficit. When the economy grows again, tax revenues rise and people find work and have pay rises -and the government has more to spend elsewhere. The borrowing by government reduces and in a boom time, in theory, government can receive more in tax revenue than it spends.
However, governments often have deficits throughout the cycle. Why is this? It's because they also borrow more money than will be received by taxes in an economic boom. This difference, between the cyclical deficit and the total deficit is known as the structural deficit, or the 'Cyclically adjusted deficit'. When we make sure there is no capital (investment) spending included we get the Cyclically adjusted deficit on current budget - the structual deficit.
Why cut the structural deficit? Well, as long as the government can fund its debt it can borrow for ever. Unlike households. However there are limits. If the debt becomes too large, investors may stop buying government debt (gilts). For the UK, investors might sell Sterling if they feared inflation. And the government's interest bill would grow, dominating the budget and putting the finances at risk of a rise in interest rates (which would increase the interest rate bill). The government can print money and use it to buy gilts (it did this during the crisis when it got the Bank of England to spend almost £375bn on gilts) but in some cases that can risk inflation and affect the value of Sterling against other countries (if people think the pound is worth less).
So central to showing you are credible on the economy and public finances is to show you mean business about getting structural borrowing down - or at least controlling it.
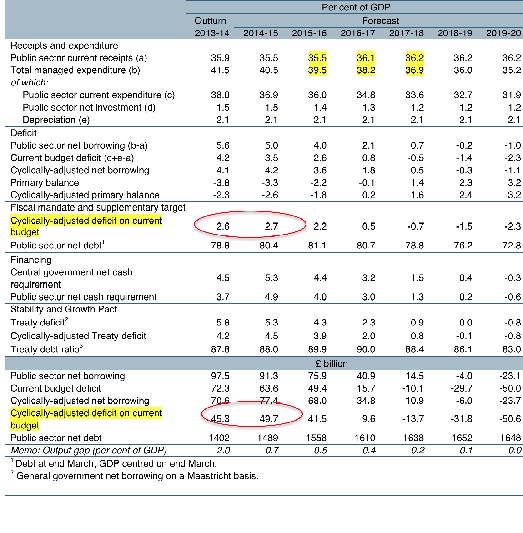
In the table below, from the OBR's latest Economic and FIscal Outlook, the government's 'Fiscal mandate' is in the third section down - I have highlighted it.. Here, it is expressed as a % of GDP. It starts at 2.6% of GDP, then goes up to 2.7%, before falling to be in surplus (a negative number) by 2017-18. Two things are going on here - overall the borrowing is going down mainly as spending is cut and GDP is growing.
At the bottom of the table we can see the actual amounts, in £ billion. Again, the structural deficit rises this year (2014-15) before falling - I've ringed round where it rises. The reason is that the OBR believes the economy is operating nearer full capacity than it thought previously. Taxes from income are well below its expectations but survey data suggests the economy doesnt' have that much spare capacity (the so-called output gap). The OBR has concluded that upside is more limited as far as tax receipts are concerned (at current tax rates) and therefore, compared to its March forecast, less of the deficit is cyclical and more is structural. Hence the figure rises.
The structural deficit then falls as spending cuts kick in further. In particular, the Treasury has told the OBR that although it doesn't have any specific plans beyond 2015-16, the OBR should assume that spending will fall at the same rate as in the current parliament (ie since 2010). We can see this in the highlighted (by me) figures at the top of the table. It's assumed tax receipts jump from 2015-16 but more importantly spending ('Total managed expenditure') falls further as a % of GDP. Those two moves combined produce a step change fall in borrowing as we can see down the table as we compare 2015-16 to 2016-17.
There are various reasons why, despite a higher structural deficit than previously thought, the OBR Outlook has helped George Osborne. A significant reason is that it assumes spending falls faster than previously forecast because the interest the government has to borrow on new debt will be much lower. The OBR has noted that gilt (government bond) yields have fallen this year - the government can borrow for 10 years for around 1.9% pa - and so has assumed that low rates continue for longer than expected. It has also corrected a £3.9bn (by 2018-19) error in its model. These changes add up year on year until the end result is an underlying downward revision to the spending forecast of almost £18bn in 2018-19.
How did we get such a large structural deficit (amount we have to borrow each year, don't forget)? The financial crisis hit the economy hard and we lost a lot of output compared to what would have happened if things had been fine. If the economy had carried on growing at its previous trend rate, we would have no, or only a small, structural deficit. So while the economy is believed to be growing at 3% this year, output (and all the taxes that would have brought) is well below the pre 2008 trend.
The huge increase in borrowing after the crisis was not mainly due to the government increasing spending by its departments in 2008-10. It was due to much lower taxes and higher benefit spending as a result of the banking disaster and consequent recession. But now the OBR (and most economists) is saying, much of that tax revenue will not be regained (or at least, the economy will never get back to the pre 08 trend level) so the spending that revenue was supposed to fund is now part of the structural deficit.
What if the government had not permitted borrowing to rise so sharply? There would have been sharp spending cuts and tax rises at a time when people were losing their jobs and businesses were struggling to survive. It would have caused a Great Depression, an act of gross irresponsibility and callousness.
Stephen Beer, 12/12/2014